
A centralized dashboard for livestock holdings, cooperatives and associations
Modiran Didban brings key performance indicators (KPIs) from multiple livestock operations together in one dashboard
- from the current herd status
- to trends over previous months.
Managers of multi-farm organizations can monitor and compare dairy cattle and small-ruminant operations in a single dashboard.
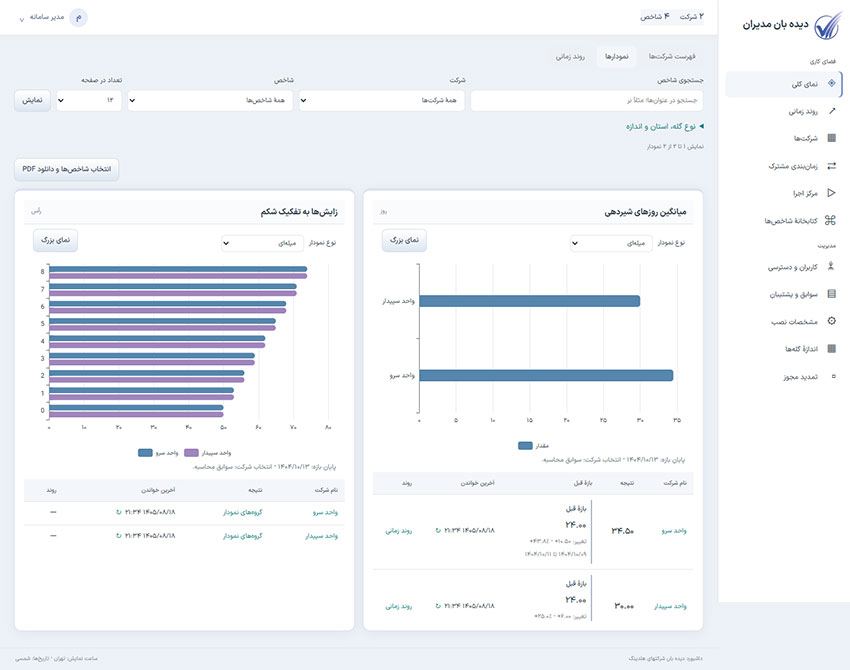
Dashboard view: comparing companies with the previous reporting period
Livestock management dashboard features
- Compare operations: view KPIs for a reporting period in tables or charts and quickly find metrics using search.
- Track trends: follow changes in each company’s numeric KPIs over time. Previous-period comparisons show the relevant date and data source.
The interface supports Persian, right-to-left layout, the Solar Hijri calendar and browser access for dairy cattle and small-ruminant operations.
Company management and KPI library
- Classify each operation as dairy cattle or small ruminants.
- Filter results by company, province and herd size; herd-size bands can be customized.
- Species-specific KPIs run only for applicable operations.
- User access can be restricted to designated companies.
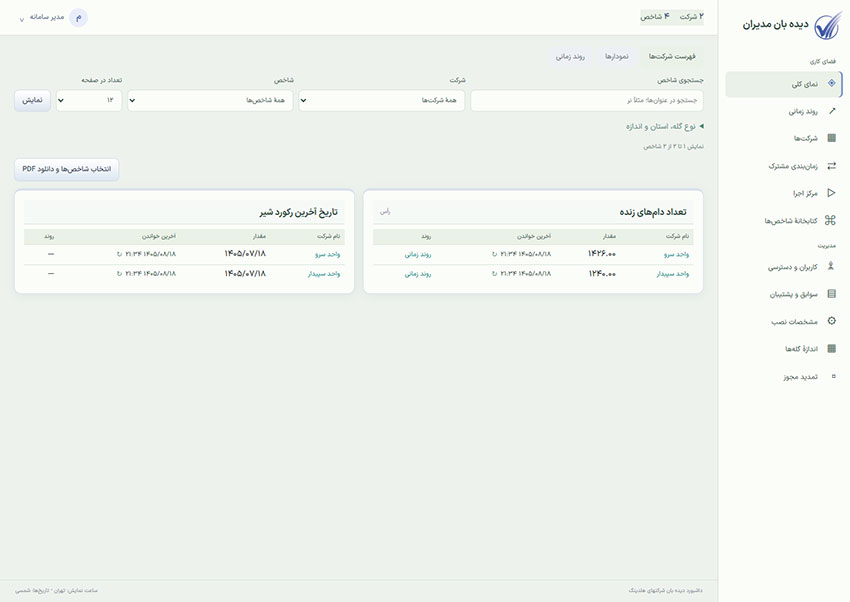
Company list and KPI results view
Extensible KPI library
- Each KPI definition and its read-only SQL query are stored in the library.
- Export tested KPI definitions in a file and transfer them between organizations.
- For historical comparisons, define a previous-period label and query within the KPI, or use stored results.
- The actual observation date of the previous result appears alongside its value.
Scheduled KPI calculations
- KPIs are calculated on a shared schedule.
- Current runs and execution history are shown separately; history can be filtered by date range.
Management reports for meetings
- Select KPIs and generate PDF reports containing tables and charts.
- Reports include the organization name, print date and time, and latest calculation timestamp.
- Each company result also has its own calculation timestamp.
- Reports use stored results without querying company databases again.
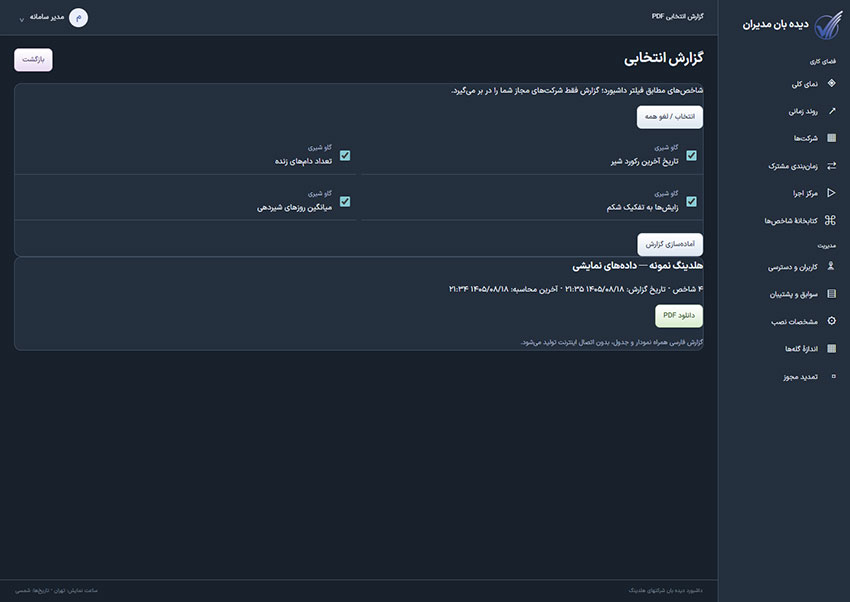 Selecting KPIs and preparing reports from stored results
Data security, backup and recovery
- Internal application data is stored in an encrypted database.
- Administrators can back up and restore data with a preview.
- Connections to SQL Server data sources use read-only credentials, preventing the application from modifying source data.
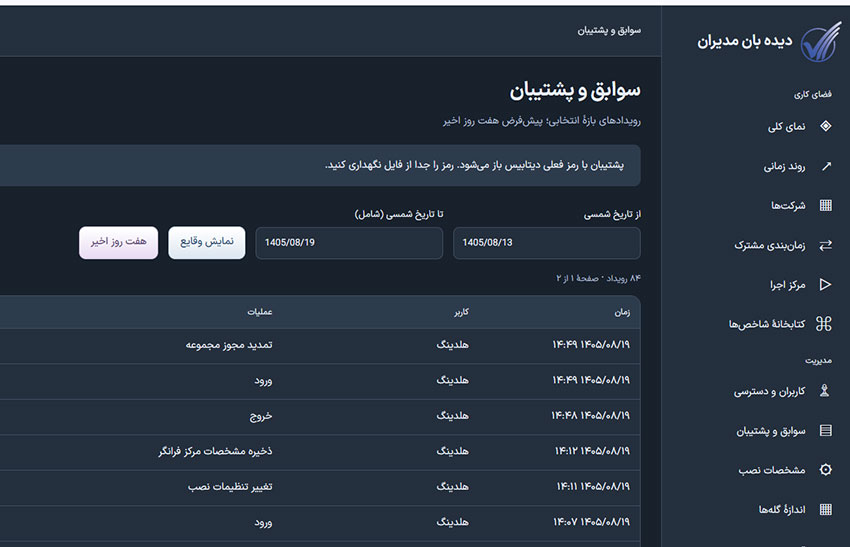
- System activity logs are recorded automatically.
On-premises deployment
- The application runs on a Windows server and is accessible through a web browser.
- Fonts and display libraries are included in the installation package. After installation, pages do not need to download these assets from the internet, supporting isolated networks.
Chart types and display settings
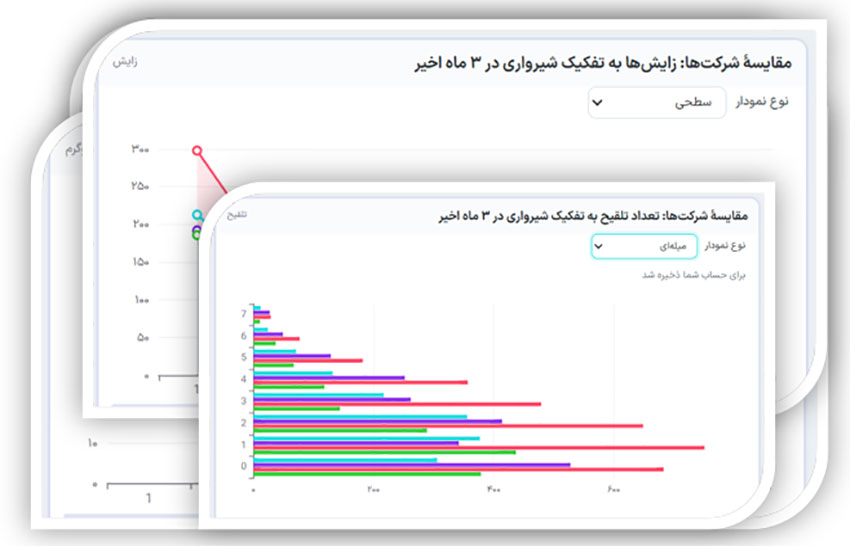
- Choose bar, line, area, pie, doughnut, scatter or gauge charts according to the data.
- Expanded chart views make it easier to examine groups and values.
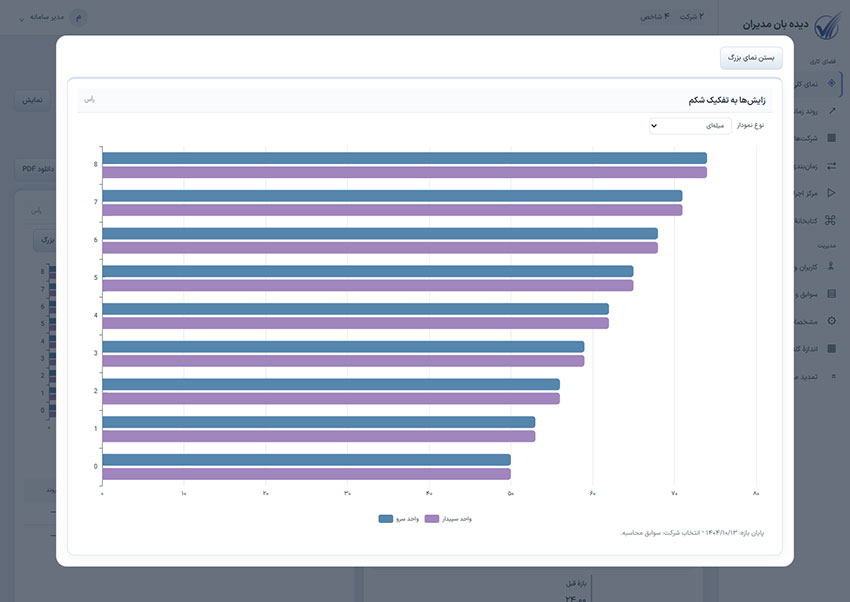 Expanded chart comparing calvings by parity
Technical requirements
- ۶۴-bit Python 3.12 installation package
- Microsoft SQL Server 2019 or later
- Ready-made KPIs are included. You may also request additional KPI definitions at no extra charge.
Select your language